

The good old days

MACKLEMORE FEAT KESHA - GOOD OLD DAYS
The good old days -- when the Fed funds rate was above CPI. It isn’t like it used to be.
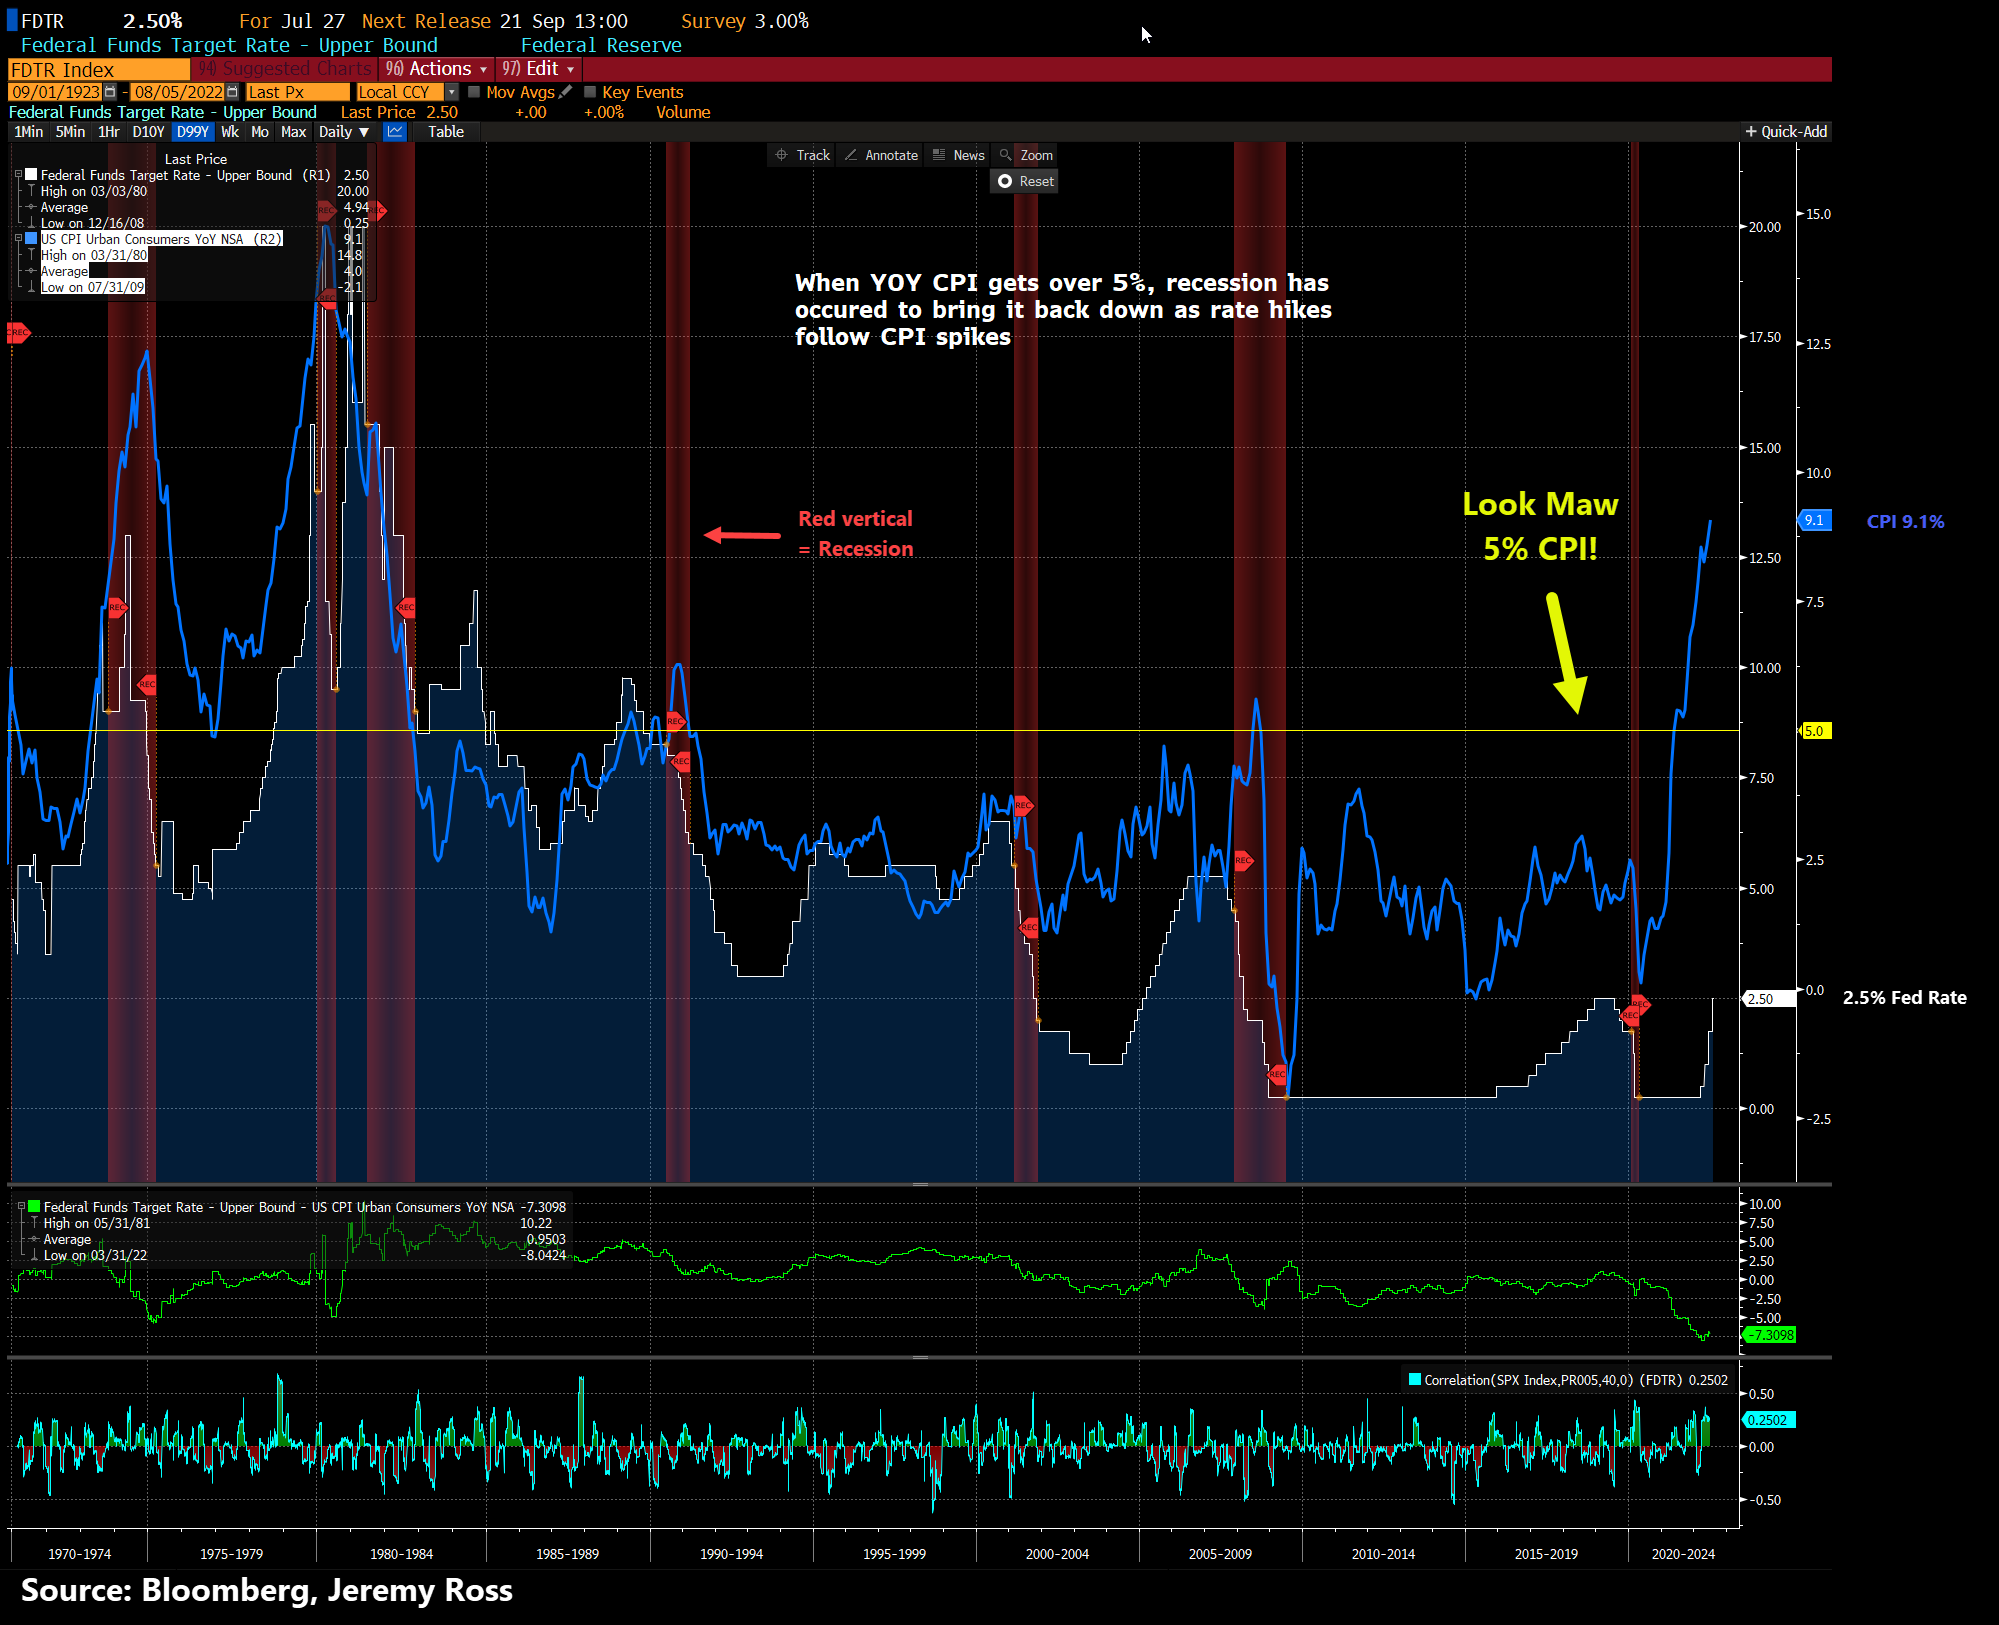
The party of color above shows the Fed Funds rate upper bound in comparison to YoY (year over year) CPI (consumer price index). The respective spread and correlation are on the lower panels.
Historically, when YoY CPI gets above 5%, the Fed Funds rate has been historically higher than CPI which puts the Feds neutral rate in restrictive territory which slows economic demand. The neutral rate is the theoretical fed funds rate at which monetary policy is neither expansionary nor contractionary.
Fed Chair Jay Powell suggests neutral rate is now a "concept" and suggests it's 2.5%. Other Fed governors who vote, suggest higher.
As you can see, we haven't been through this before historically where the Fed's policy rate is so much lower than CPI, particularly when the Fed has an active policy to lower inflation.
Recessions historically lower CPI, as the next table shows, by an average of -6.8% (with omitting the recessions where CPI was <3%). CPI usually continues to fall long after the recession is over, averaging 16.2 months to get to 2%, which is the Fed's congressional mandated inflation target rate.

Source: The Macro Compass
So since a recession may be in the cards before the end of 2023…
Stocks usually bottom aprox 2/3rds of the way into the recession, often offering a potentially rewarding YoY performance 1 year after from the bottom. +40% gain at aprox 2/3rds of the way through the recession is often typical.
SPX Index YoY % change chart. % change YoY on the right.

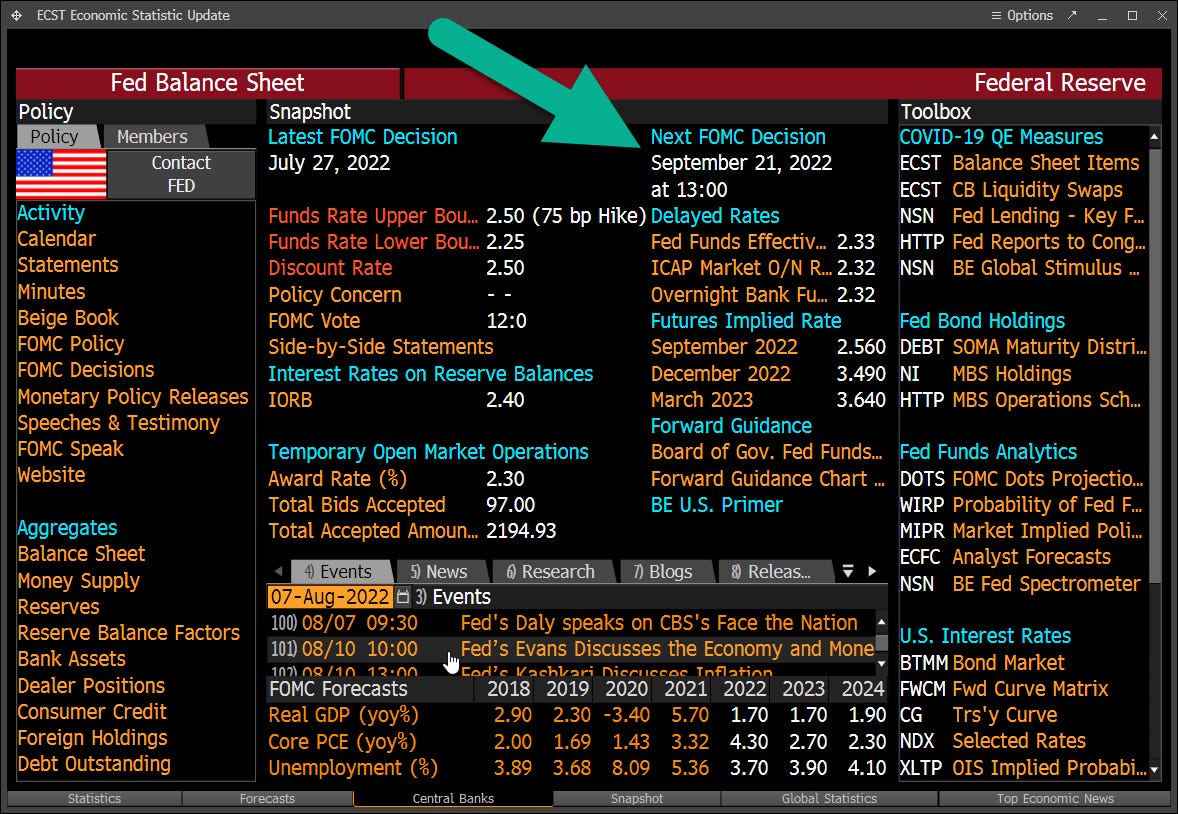
The next date to set the Fed's policy rate is 9/21/22. If we continue to get strong results in economic data that the Fed says publicly it will react to and is watching closely -- the risk-on rally we witnessed recently in risk assets -- the thinking that fueled that may shift.
The Fed has publicly mentioned they are paying close attention to employment and inflation data. There are four key employment and CPI event releases before the next Fed meeting.
The first employment report was released this last Friday and came in more than twice as hot as expected. Survey 250k -- actual 528K. The employment and wage data is important as wages are tied to approx. 70% of all costs.
The recent nonfarm payrolls on Friday 8/5/22.

With labor being tied to approx. 70% of all costs, if the earning rate of wages is much higher than the Fed's 2% inflation mandate, that is an issue that the Fed needs to address.
MoM and YoY earnings are moving on up, both higher than recent survey #'s. Unemployment rate lower to 3.5%.
A non-granular view of the payroll # last Friday. Services increasing momentum, which should be expected, as we normalize from the covid event.

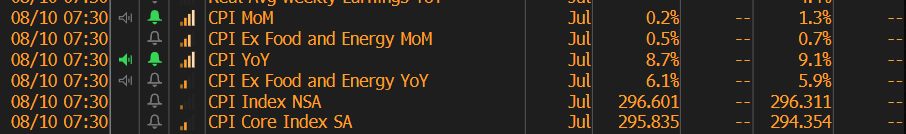
CPI event release on 8/10/22.
Lets circle back to the first/top chart. Historically when inflation ran hot, the Fed's policy interest rate has been above CPI, making the Fed's policy rate constrictive, thereby lowering demand, thereby lowering inflation.
Today, were nowhere near that. Policy rate is 2.5, inflation 9.1%.
The Taylor rule is a model that can calculate (it's not perfect) what the suggested Fed's policy rate should be when inflation is above target or when GDP growth is too high and above its potential, in order to help assist inflation get back to the Fed's 2% congressional mandate.
Two variables involved, the 3.5% unemployment rate and PCE (US Personal Consumption Expenditure Core Price Index YoY). The neutral rate is commonly believed to be 0.5% above the inflation rate (the Fed chair is stating it’s 2.5%).

This model suggests with the current labor market and inflation data, a Fed's policy rate of 9.69%, which way above the current 2.5% rate. I bring this up because if the economic event releases that the Fed may react to, if those don’t cool down before the next Fed meeting in September, it's reasonable to think that the rate hikes that will happen in the future will be more than what the market currently has priced in. If that happens, the thinking that sparked the recent rally in risk assets will be revisiting the same issue again, which has been a source of such weak performance this year.
Next is the current pricing of forward hikes and cuts in policy rate as of 8/5/22, in the red boxes. The market expectations for policy decisions can be useful because it informs what is priced in the market, in other words, market expectations of future policy decisions.

Historically. future expectations of the policy rate decisions have been a poor predictor of what the Fed ends up doing with its policy rate.
It may be the case, that current pricing is misinterpreting on the lower end of what the future rate hikes may be if we continue to get stronger than expected employment and inflation event releases.
Last year, on 8/6/21, there wasn’t even one 0.25 rate hike priced in for all of 2022.

See how much things have changed? In December of ‘21 the Fed pivoted and began to modify its policy in order to lower inflation. As a result, stocks and bonds were repriced. The progressive issue with normalizing supply chains, the war in Ukraine, and stimulus the Americans received from government transfer payments during Covid, has helped inflation become more persistent than what was previously expected.
In the next model, let’s look at the potential impact of rate hikes to the economy. I added 1.5% (current pricing is 1.287, as seen above in the red box) Fed policy rate increases to the 4th quarter of 2022. The policy moves today operate with a lagging effect on the economy and may not fully take effect for approx. 3 quarters in the future (1 quarter = 3 months).

Cheers!
This post, and others, may not be what may be coming in the future, which should be a statistical breakdown of historical results based on current events in the financial markets.
Fun fact, when the Fed Chair spoke on the days of this year that was the last day of each FMOC meeting to publicly announce the Fed's policy interest rate decision, starting when the Fed chair has publicly declared the goal of a soft landing for the US economy, if you owned the S&P 500 index on only the days the Fed chair spoke at the last day of the FMOC policy announcement, and owning nothing the other days the market was open every day during 2022, you'd be up 6.8%. Buy at open that day and sell at close. This has only worked starting the date the Fed chair declared the intent/goal of a soft landing.
Charts and/or data sourced from Bloomberg Professional unless otherwise noted.
TERMS OF USE
thestatreport.substack.com (“Site”) is a website owned and operated by Substack. By accessing this Site, any page thereof, or any social media account, you are indicating your consent and you agree to be bound by the Terms of Use and Disclaimer. The Terms of Use and Disclaimer may be amended from time to time.
DISCLAIMER
theSTATreport, its affiliates, respective owners, representatives, members, directors, officers, managers, agents, trustee’s, clients, friends, family, or employees (collectively, the “STAT Parties”) presents this communication and content for your informational purposes only. This material is for illustration and discussion purposes only and are not intended to be, nor should they be construed as, financial, legal, tax, or investment advice and does not constitute as an opinion or recommendation or advice or offer or solicitation by the STAT Parties.
Certain information has been provided by and/or is based on third party sources and although such information is believed to be reliable, STAT Parties makes no representation with respect to the accuracy, completeness, adequacy, or timeliness of such information. This information is being presented “as is” without warranty, express or implied, of any kind whatsoever. This information may be subject to change without notice. Everything is subject to revision by STAT Parties and STAT Parties is under no obligation to update, amend, modify, or supplement this publication, in whole or part, or any of the information contained herein under any circumstance.
Any financial instruments mentioned herein are speculative in nature and may involve risk to principal and interest. Past Performance is not indicative of future results. Any prices or levels shown are either historical or purely indicative. STAT Parties may from time to time enter into securities transactions, including, but not limited to, involving buying, selling short, hedging, in securities covered in this and other publications before or after a publication is issued. To the extent any of the STAT Parties have such positions, there is no guarantee that STAT Parties will maintain such positions. Any statement in this publication regarding performance is not indicative of, and does not guarantee future results, or that anticipated results may be realized.
The recipient of this must make his/her/its own independent decisions regarding any legal, tax, securities, investment products, or other financial products mentioned herein. Seek independent professional consultation in the form of legal, investment, tax, and fiscal advice before making any investment, legal, tax, or financial decision. The information and opinions provided herein should not be taken as specific advice on the merits of any decision. The STAT Parties does not accept any liability whatsoever for any direct or consequential loss howsoever arising, directly or indirectly, form any use of the information contained herein.
Unauthorized reproduction of this newsletter or its contents by photocopy, facsimile or any other means is illegal and punishable by law.
Always perform your own due diligence.