

In Focus: What the FOMC's Decisions can mean for Your Money
In Focus: What the FOMC's Decisions can mean for Your Money
Consensus Thinking can be a Dangerous Place to be if You're Goal is that You Need to be Right

Check out our - Best Articles | Twitter
theSTATreport^ is home of the “In Focus” series. A data-driven, in-depth, evidence-based series about the US Fed, FOMC, US Economy and the Financial Markets.
In this article:
Major Bottoms in Stocks happen During Recessions and After the FOMC has been Cutting Rates.
Discover Why a June FOMC Rate Pause is Likely to be Followed by Rate Cuts
Key Reasons why Inflation Reports should be Lower in the Months Ahead
Key Drivers of S&P 500’s performance since the last FOMC Meeting
Detailed charts of Two Catalysts of Major Stock Market Bottoms and Where We are Today

It’s not typical for new major bull markets to start when the US Economy is not within a recession and when the FOMC isn’t cutting rates. Major bottoms occur when the US Economy is in a recession and after the FOMC started cutting rates or paused. More details at the end of this post.
STAT SPOTLIGHT: Recessions have caused stocks to fall every time in the last 117 years.1
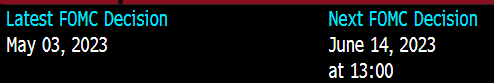
The coming June 14th FOMC decision may mark the first time since March of 2022, after 10 consecutive increases, the FOMC will vote not to hike rates.
Whether the FOMC labels this as a skip, hawkish skip, hawkish pause, or something else - history says the bar may be set pretty high for another hike to occur at some point during this cycle - and what might occur next after the upcoming June meeting, is a rate cut.
STAT SPOTLIGHT: Historically when the 2YR/10YR yield curve is this inverted, the FOMC has cut rates 1-4 months after the first pause.2

“We’ve come a long way in policy tightening and the stance of policy is restrictive and we face uncertainty about the lagged effects of our tightening so far and about the extent of credit tightening from recent banking stresses,
Having come this far, we can afford to look at the data and the evolving outlook to make careful assessments,” Powell told a Fed conference in Washington in May 2023.
Historically, its rare for the Fed to re-tighten policy after pausing. It’s even rarer for it to do so when rates are already restrictive.
As the chart below shows, hikes after pauses came in the 80’s when rates were in a longer-term downtrend. That is unlike today.

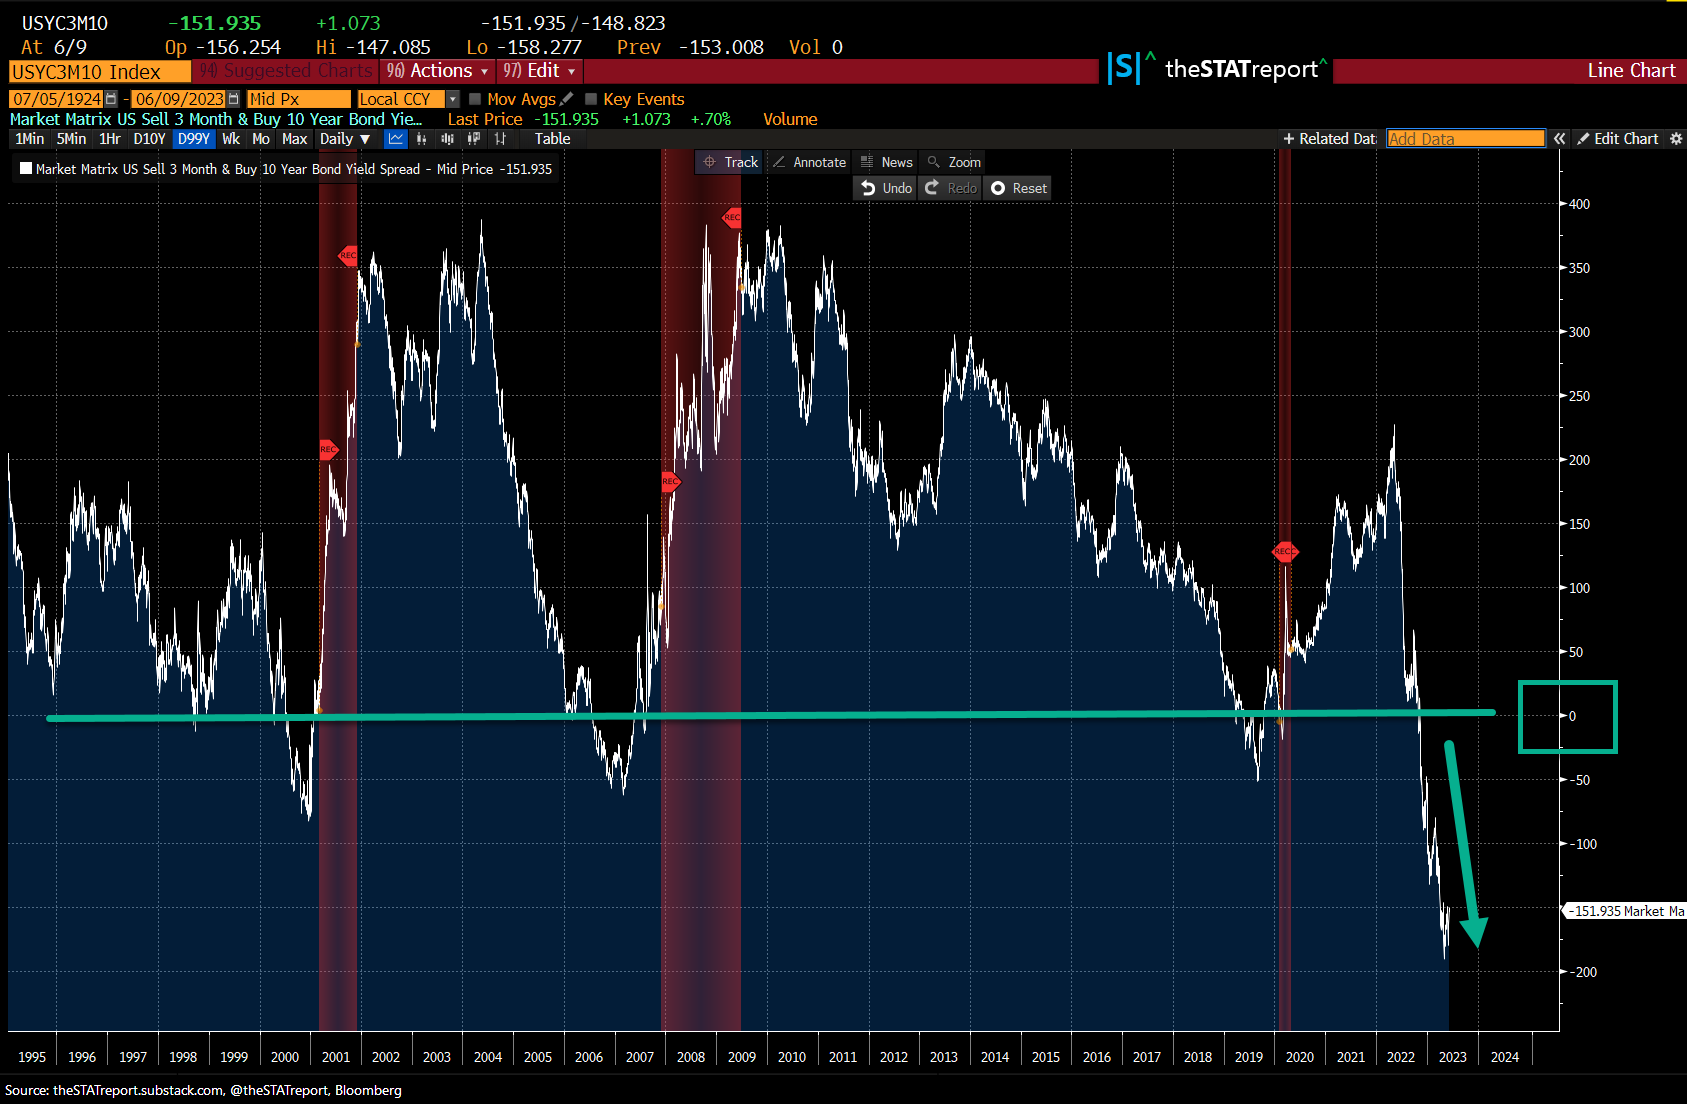
By several measures, rates are already restrictive. This can be underscored by the yield curve’s inversion, which gives us a read on how restrictive rates are. The 3MO/10YR spread is below. Red lines mark recessions. The farther below 0 the spread gets, the more restrictive rates are.
The inflation statistic reporting backdrop will also look very different in the months ahead.
Zillow YoY Rent Index peaked in February 2022. YoY CPI rent of shelter should soon follow.
Shelter makes up 32% of the CPI Index. There is a lag, historically approx 6 months, for what has happened with the price changes in the housing market to show up in the inflation statistics. As shown in the chart above, the change in the white line lags the change of the blue line. This should start to show up in the statistics dragging CPI lower in May and June.


Powell’s super core CPI YoY, which excludes shelter, shows disinflation.

CPI statistics will likely show disinflation ahead, as the base effects materialize, within the reported statistics. Below are some projections.

If we see strong disinflation coming in the months ahead, that may be another reason to cause the FOMC to go on an extended pause.
Revised employment data from BLS for first quarter of 2023 shows unit labor costs and real hourly compensation wasn’t as strong as originally reported. (Keep in mind - revisions are common.)

Both temp help and hours worked are falling. The jobs situation – and therefore the Fed’s risk-reward for hiking rates again – could look different in the coming months, especially as a near-term recession looks likely.
Two forward-looking employment indicators of the labor market are temporary help and average weekly hours worked. Both temp help and hours worked are falling.

Many forward-looking economic indicators, such as the ISM new orders surveys and Leading Economic Indicators, are weak. The Fed has often been cutting interest rates when the data has been near today's levels.

Key drivers of the SPX Index, since the last FOMC meeting, were risk on sentiment and economic demand.

Stocks historically wait until the FOMC starts to cut rates before making a major low (dashed line below). If this really is a new bull market from a major bottom, it’s not often that a new bull starts when the FOMC was still hiking rates as they were in October 2022. Every dashed vertical line was during rate cuts with exception to 2022.
More detailed chart of 2022 below. Long term bull in stocks started when FOMC was hiking rates?
If a recession has only been delayed, it’s not typical for a major low in stocks to be already in. That doesn’t necessary mean the October 2022 lows will be taken out when a recession does arrive. Big picture, it’s important to keep in mind that recessions have caused the Dow Jones Index to fall every time in the last 117 years from the recession onset. I’ll do a post on what happens to stocks after the start of a recession in the future and the mounting evidence suggesting a recession is ahead. Stay tuned!
In the chart below: Top Panel: Fed’s Upper Bound rates. Bottom Panel: SPX Index. Recessions in red. Its within historical experience that recessions with rate cuts are catalysts for major stock market bottoms.

When does the FOMC cut?
Historically, cuts arrived 1-4 months after the last hike when the 2YR/10YR curve was in deeper inversion territory during the late 70’s and early 80’s. With this current business cycle being atypical, this should probably be best viewed as an historical observation, not an expectation of a future outcome. At the point the line in the bottom panel falls after being horizontal and after increasing - the first decrease is the FOMC cutting rates. The 1-4 months comes from the time frame of the line going horizontal after increasing, before it falls.
Bigger picture of where we are today vs history.

The Fed increased rates 500bp during the previous 10 meetings.
For demonstration purposes to show the potential lag effects of monetary policy, I applied a 500bp increase to the US Economy during the 2nd Quarter of 2023.
In this example, with no changes in addition to the 500bp increase applied to Q2 2023, that policy change will be a drag on GDP though 2026, using this model.
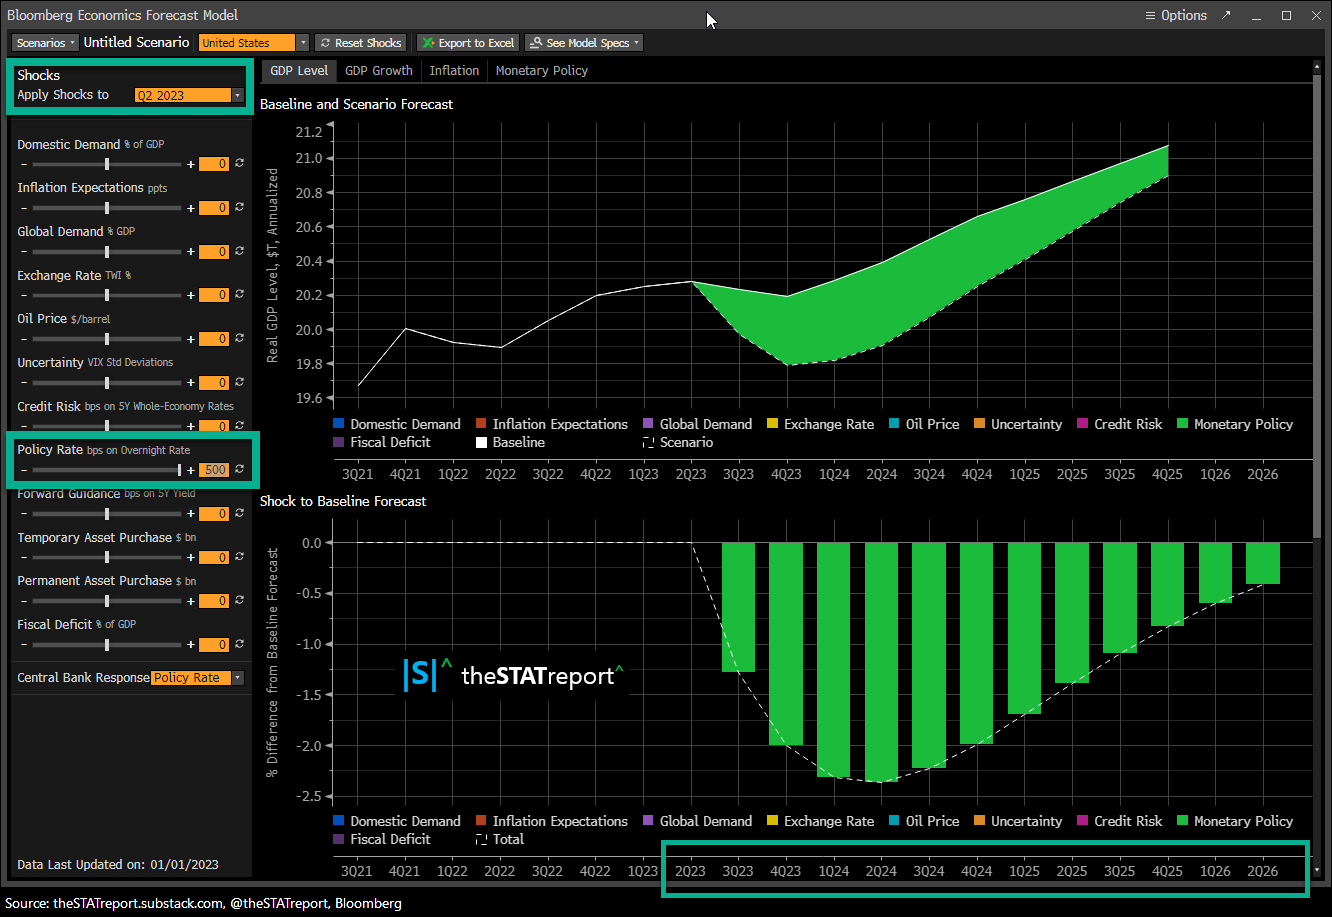
It will also take time for inflation to soften in the reported statistics and should have a drag effect on inflation into 2026, when applying the 500bs shock to Q2 2023.

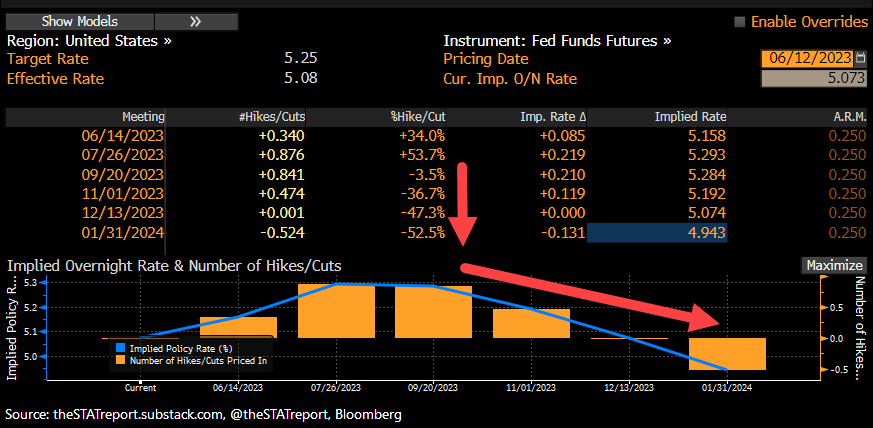
As of 6/11/23, below is the current market expectations for Fed policy for the FOMC’s meeting dates ahead. Whatever the future expectation is, history shows that the odds of that materializing during periods of policy changes are not high.
Below, the white line is what FOMC actually did, and the amber lines, is what the market had priced for what they thought the likely outcome was going to be for future FOMC meeting dates, at that time frame.

This demonstrates that during policy changes, market expectations don’t have a strong history of getting future policy moves right.
If you found something of value within this article, please like and/or share it. Subscribe, if you are not subscribed. If you have a comment or question, please leave a comment or ask your question in the comments. This allows others to benefit from the interaction.
TERMS OF USE
thestatreport.substack.com (“Site”) is a website owned and operated by Substack. By accessing this Site, any page thereof, or any social media account, you are indicating your consent and you agree to be bound by the Terms of Use and Disclaimer. The Terms of Use and Disclaimer may be amended from time to time.
DISCLAIMER
theSTATreport, its affiliates, respective owners, representatives, members, directors, officers, managers, agents, trustee’s, clients, friends, family, or employees (collectively, the “STAT Parties”) presents this communication and content for your informational purposes only. This material is for illustration and discussion purposes only and are not intended to be, nor should they be construed as, financial, legal, tax, or investment advice and does not constitute as an opinion, or recommendation, or advice, or offer, or solicitation by the STAT Parties.
Certain information has been provided by and/or is based on third party sources and although such information is believed to be reliable, STAT Parties makes no representation with respect to the accuracy, completeness, adequacy, or timeliness of such information. This information is being presented “as is” without warranty, express or implied, of any kind whatsoever. This information may be subject to change without notice. Everything is subject to revision by STAT Parties and STAT Parties is under no obligation to update, amend, modify, or supplement this publication, in whole or in part, or any of the information contained herein, under any circumstance.
Any financial instruments mentioned herein are speculative in nature and may involve risk to principal and interest. Past Performance is not indicative of future results. Any prices or levels shown are either historical or purely indicative. Any projections, market outlooks, or estimates herein may be forward looking statements and are inherently unreliable. They may be based upon certain assumptions and should not be construed to be indicative of the actual events that will occur. Other events that were not taken into account may occur and may significantly affect the returns, performance, or outcome of everything mentioned herein. The information provided herein is based on matters as they exist as of the date of preparation and not as of any future date.
STAT Parties may from time to time enter into securities transactions, including, but not limited to, involving buying, selling short, hedging, in securities covered in this and other publications before or after a publication is issued. To the extent any of the STAT Parties have such positions, there is no guarantee that STAT Parties will maintain such positions. Any statement in this publication regarding performance is not indicative of, and does not guarantee future results, or that anticipated results, may be realized.
The recipient of this must make his/her/its own independent decisions regarding any legal, tax, securities, investment products, or other financial products mentioned herein. Seek independent professional consultation in the form of legal, investment, tax, and fiscal advice before making any investment, legal, tax, or financial decision. The information and opinions provided herein should not be taken as specific advice on the merits of any decision. The STAT Parties does not accept any liability whatsoever for any direct or consequential loss howsoever arising, directly or indirectly, from any use of the information contained herein.
Unauthorized reproduction of this newsletter or its contents by photocopy, facsimile or any other means is illegal and punishable by law.
Always perform your own due diligence.
Lookback 117 years from 2023. Using Dow Jones Index using the start dates as the first day of the month of the official NBER month and year the recession started. Start month and year of recession dates found at NBER.
Lookback to 1977.