

An Inside Story
An Inside Story
What "Higher for Longer" Rates Really Mean. How the R* Neutral Rate of Interest Influences Monetary Policy FOMC Decision-Making.

In this article:
Star Gazing at the R - What is It?
The Meaning of “Higher for Longer” Rates
Why is R* important?
Scenario Analysis for Rate Policy during 2024
How the Fed uses R* to Set Policy
Reference Shelf
Star Gazing at the R - What is It?
R-Star, often stylized as R*, is the natural rate of interest consistent with the absence of any inflationary or deflationary pressures when the Fed is achieving its policy goals of maximum employment (zero output gap) and stable prices (consistent with the Fed’s 2% inflation target).
The Meaning of “Higher for Longer” Rates
Does “higher for longer” interest rates mean rates will be held at a constant level for a longer period of time?
It’s not about keeping nominal rates higher.
It’s not about keeping the real interest rate higher.
It’s about keeping the distance of the real rate relative to the R* rate at the desired level in order for the FOMC to achieve their policy objectives. For example, if R* is declining, the policy rate should decline with it to maintain the desired level of restrictive or accommodative policy in pursuit of the FOMC’s policy objectives. If the R* estimate is increasing, the policy rate should increase to maintain the desired level of restrictive or accommodative policy.
STAT SCHOOL: If John Williams R* ‘23 estimate is accurate at 0.6%, and the FOMC believes that inflationary expectations are anchored at 2.2% - this means that a policy rate that is higher than 2.8% (R* + inflation expectations) would be restrictive. Todays upper bound policy rate of 5.5%, would be considered very restrictive, based on this 2.8% estimate.
Inflation Expectations + R*. If the FOMC’s policy rate is higher than inflation expectations + R*, that policy rate would be considered restrictive. Conversely, if the FOMC’s policy rate is lower than the inflation expectations + R*, then that policy rate would be considered stimulative.
Fed’s Common Inflation Expectations.

The Fed’s R* estimates can vary between the different Federal Reserve districts. Currently range between 0.6% and 2.16% as seen below.

Why is R* important?
In the long run, central banks want their policy to be consistent with what they think the neutral rate is. The R* number also guides their thinking about where interest rates should be in the short term. If the economy is operating below full capacity, they want to make sure interest rates are below neutral levels so that they’re helping boost economic growth. Conversely, if inflation is too high, they want to keep interest rates above neutral levels in order to slow the economy down.
Scenario Analysis for Rate Policy during 2024
With the dangerous risk of prejudging any particular potential future outcome, below are some potential ways this may play out.

Blue Line: Mild recession begins before the end of 2023. FOMC cuts during 2024.
White Line: Federal Reserve estimate based on June dot plot. Dot plots are updated each quarter. The next update is during September.
Amber Line: An environment where inflation is higher than analysts and inflation swaps are pricing forward inflation currently and inflation remains stuck at 3%. 50 bps of rate cuts are likely during 2024.
Pink Line: This requires Core PCE Inflation to flare up to 5.1%. One narrative is that the economy is accelerating, there is no landing in sight, manufacturing cycle has bottomed out and reaccelerating, while the housing market has bottomed out and reaccelerating. With this scenario, the increases in the Core PCE Inflation data won’t show up in the reported statistics until near the end of 2024. Rate hikes in this scenario may resume near the time the Core PCE inflation statistics increase.
The reason why there may be a cut in early 2024 is the inflation story may be dominated by the disinflation in housing rents and cars showing up in the reported inflation data.
One risk to the four potential scenarios above is Bidenomics. Bidenomics is offering the economy a fiscal boost amidst the FOMC’s monetary drag.
Bidenomics is fueling spending in the manufacturing sector which in turn increases GDP.

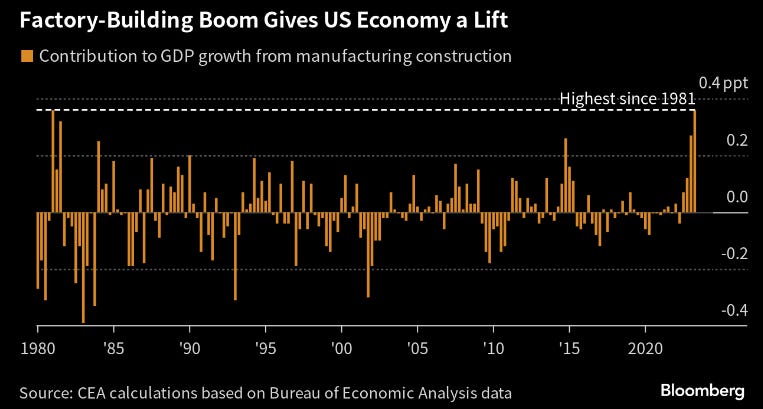
This acts as a counterforce of what the Fed is trying to do, which is to cool the economy. This may be a factor in the analysis above - within the Pink Line Scenario - where the FOMC may have to hike rates during 2024.
In addition, the structurally larger fiscal deficit and less globalization should influence an increase in the R*. As a result, this may influence the longer term treasury yields to be higher in the coming years.
Potential Policy Path of Various R* Scenarios through 4Q 2024.
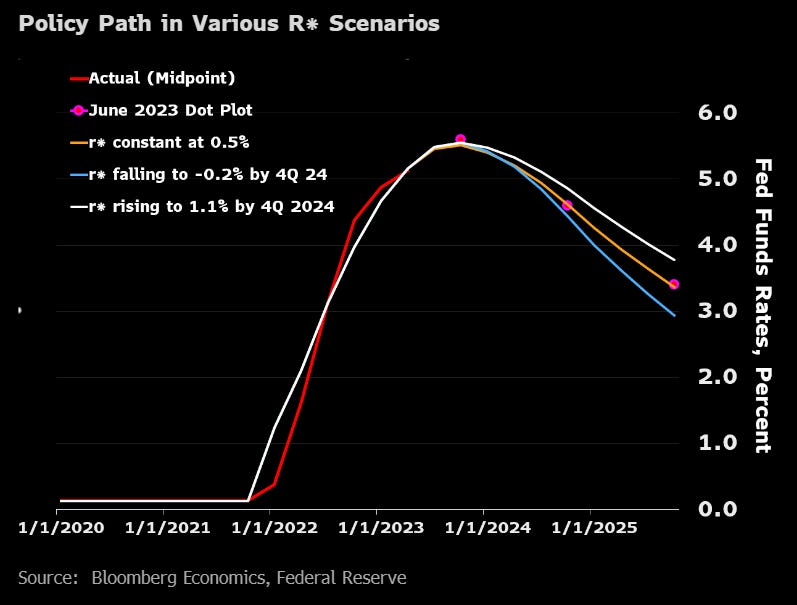
Blue Line: In the low-R* scenario, BE’s policy rule suggests the Fed funds rate will be 4.4% at the end of 2024 (vs. 4.6% in June’s dot plot) and 2.9% at end-2025 (vs. 3.4% in the dot plot). Expressed another way, these results suggest the Fed will cut rates by about 110 basis points (vs. 100 bps in the dot plot) in 2024, and another 150 bps (vs. 120 bps in the dot plot) in 2025.
White Line: In the high-R* scenario, BE’s policy rule suggests the Fed funds rate will be at 4.9% at end-2024 and 3.8% at end-2025. That implies the Fed will cut rates by 70 bps next year and about 110 bps in 2025.
A caveat about the above scenarios: they use the same assumptions about forecasted inflation and unemployment. In reality, growth and inflation will likely be higher if R* is higher — and, conversely, lower if R* is lower. That means BE’s estimate may be conservative in both scenarios.
The R* rate is cyclical. It should move lower during a recession. If the long and variable lags of past rate hikes hit the economy toward the end of this year the argument that the neutral rate is low could gain traction.
Below is the current average pricing of Fed funds futures which is priced for the cuts at end of 2024. This is more consistent with BE’s low-R* scenario than the high-R* scenario.

It’s important to keep in mind with the pricing of the Fed Funds Futures market -particularly during policy shifts - the majority of the time the prices reflecting what future policy may likely be is often incorrect.
For predicting where Fed funds rates would go beyond 2023, the less volatile long-run neutral rate concept is more relevant. What’s below demonstrates that there is a variety of views on where neural might be.
How the Fed uses R* to Set Policy

The Laubach Williams Natural Rate of Interest estimate shows that this neutral rate estimate has a declining long term trend. As a result, during 2010, this is what motivated the Fed to pursue a policy of flexible average inflation targeting, which was abandoned during 2022. Research suggests that structural forces such as an aging population and low productivity growth would ultimately result in a lower neutral rate.
Fed’s Vice Chair John Williams sees the neutral rate falling into negative territory during 2024 and holds the view that the pandemic has not reversed the trend decline in R*. Williams thinks that R* is 0.6% during 2023.
John Williams of the NY Fed is the second highest ranked FOMC member. If his concept of a -0.2% neutral rate by the end of 2024 is pursusave in which this becomes consensus, this should be a factor that may bring rates lower during 2024.
Richmond Fed estimate is 2.16% as of the first quarter of 2023.
If this is correct, the minimal level of the Fed’s Policy rate to be restrictive is at least 4.4% (neutral rate + inflation expectations). With the current upper bound policy rate at 5.5% - the Richmond Fed R* estimate of 2.16% would be minimally restrictive in relation to the Williams R* estimate of 0.6%. This is one of the debates that is going on in Jackson Hole WY this week.
Alternatively, a DSGE model at the New York Fed sees five-year R* at about 1.1%.
Dallas Fed has its own view published in July 2023.
Chair Powell within some of his speeches has communicated his skepticism of being able to accurately calculating the current R* and forming policy around it. Powell has communicated, the only way to know what R* is with any confidence, is to judge the performance of the economy. He told lawmakers in March, “honestly, we don’t know” where the neutral rate is.
Powell in his 2019 speech, “Challenges for Monetary Policy.” As he put it:
Because the most important effects of monetary policy are felt with uncertain lags of a year or more, the Committee must attempt to look through what may be passing developments and focus on things that seem likely to affect the outlook over time or that pose a material risk of doing so. Risk management enters our decision-making because of both the uncertainty about the effects of recent developments and the uncertainty we face regarding structural aspects of the economy, including the natural rate of unemployment and the neutral rate of interest.
Reference Shelf
NY Fed on Measuring the Neutral Rate.
NY Fed Williams speech on Neutral Rate.
Richmond Fed Fault in the R star.
Richmond Fed Lubik-Matthes Natural Rate of Interest.
Chair Powell 2018 speech including R*.
Former Vice Chair Lael Brainard 2018 Speech on the meaning of neutral.
Dallas Fed on the neutral rate.
NY Fed Post Pandemic R*.
NY Fed Williams 2023 Conference Measuring the Natural Rate of Interest: Past, Present, and Future.
Dallas Fed on Gauging U.S. monetary policy via the natural rate of interest.
John Williams 2003 Paper on the Neutral Rate.